Mine Production
Precious Metals Mining is a unique website which explores the contemporary global precious metals mining industry.
A primary focus is annual production figures and the accompanying analytical narrative.
The figures are built from the bottom-up and tested against publicly available data sources.
The results are shown in deeper local detail and with broader global analysis than can be found anywhere else, and are available to download from the website for free.
All figures are in troy ounces unless otherwise stated.
Precious Metals Mine Production
Gold and silver can be found just about everywhere on earth, but not necessarily on a commercially mineable basis.
The site might just as easily have been called “monetary metals”, however, production figures for base metals and PGM (Platinum Group Metals) mines are included insofar as precious metals production (as a by-product) is involved.
A key objective is to provide a curated path through the data for specific audiences to get to the information they require.
This approach describes gold and silver production, plus the associated “project pipeline” of future production, using three elements:
- the geography, puts names and places to the relevant countries and regions,
- the ownership identifies who owns the mining infrastructure, and
- the infrastructure, describes the mines and projects
Reports generated by the combination of these three elements, (defined in detail here) are compared against:
- global peak body/geological survey reporting, to validate its coherence and consistency, and
- independent feedback and posted commentary to identify and resolve any errors. Register here.
By cross referencing against multiple data sources the detailed “picture resolution” is available at both a global and a local level.
Gold Production
Globally, the map below shows, on a graded scale, countries which mined the most gold in 2023 – the darker the shade the larger the volume produced. Russia, China and Australia are the top three producers by a clear margin.
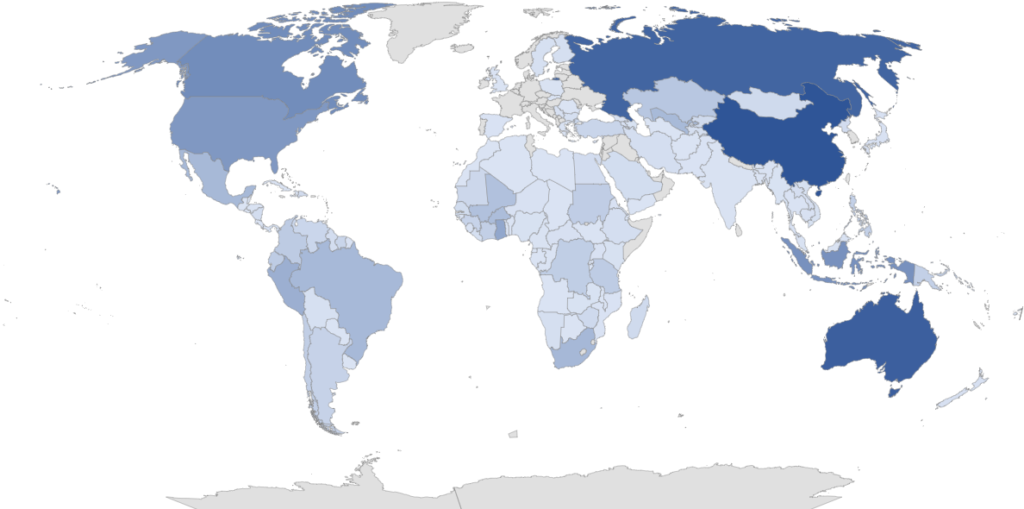
The table below provides gold production numbers for the map above. The table can easily be downloaded.
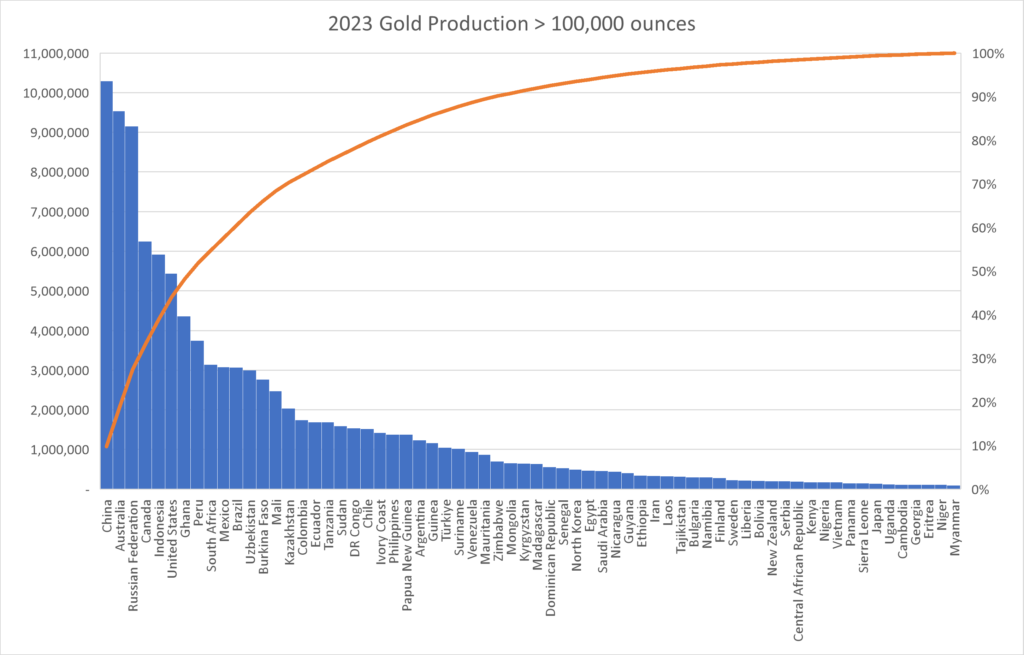
The following chart gives a relative scale of the production of the top gold producing countries in 2023 (over 100,000 ounces per year).
Silver Production
The map below shows, on a similar graded scale, where silver is mined around the world. Mexico is, by far, the leading producer, with China and Peru the next two largest producers.
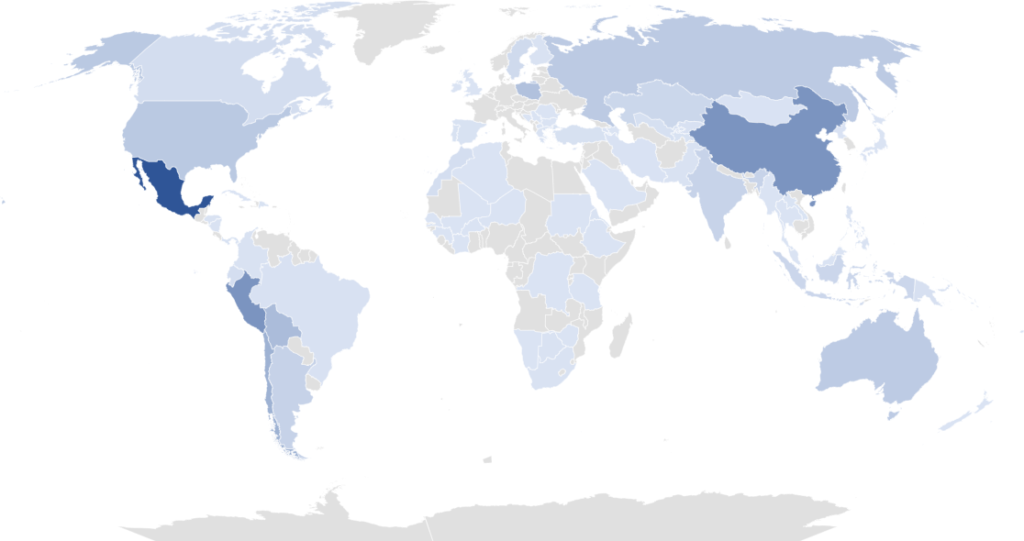
The table below provides the silver production figures for 2023 and is the legend for the chart above.
The top silver producing countries (over 1 million ounces per year) are shown in the chart below.

Wiki and Data Aggregation
This site, therefore, can also be used in a number of ways, primarily as:
- A portal into the precious metals mining production numbers – the “wiki” of precious metals mining data
- An aggregater of gold and silver data to provide a window for entities looking to acquire, divest or simply understand global precious metals mining properties.